

movieseals
-
Posts
451 -
Joined
-
Last visited
-
Days Won
7
Content Type
Profiles
Forums
Gallery
Downloads
Articles
Store
Blogs
Everything posted by movieseals
-
I truly appreciate everybody's help. Just been trying to figure this out for over 9 hours... I am able to connect with Redis and Memcache to the same localhost, granted through different ports, so that cannot be the issue. I know the port for elastic search is open, the server says so.
-
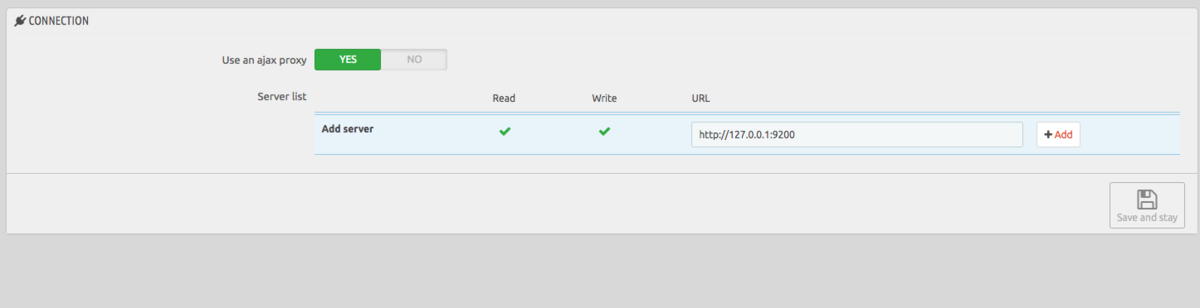
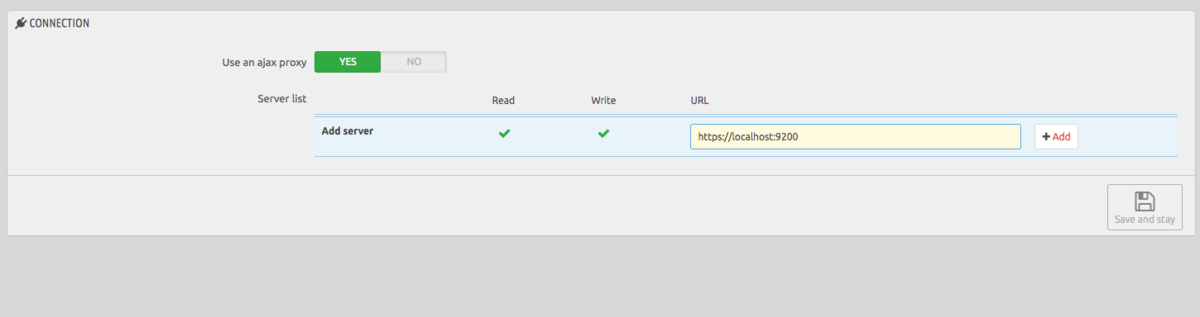
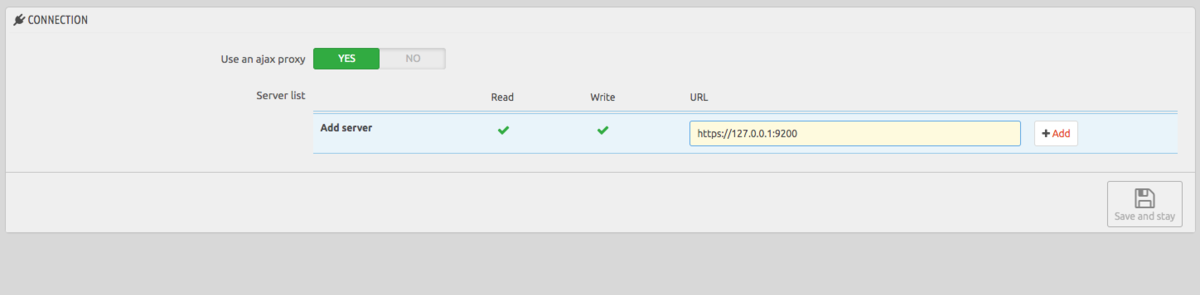
I tried with or without https (just in case and for good measure!): http://127.0.0.1:9200 https://127.0.0.1:9200 https://localhost:9200 http://localhost:9200 Regardless of the combinations, I get a connection error as if nothing has been configured at all! I tried with or without Ajax proxy. I really cannot tell what I am doing wrong!

-
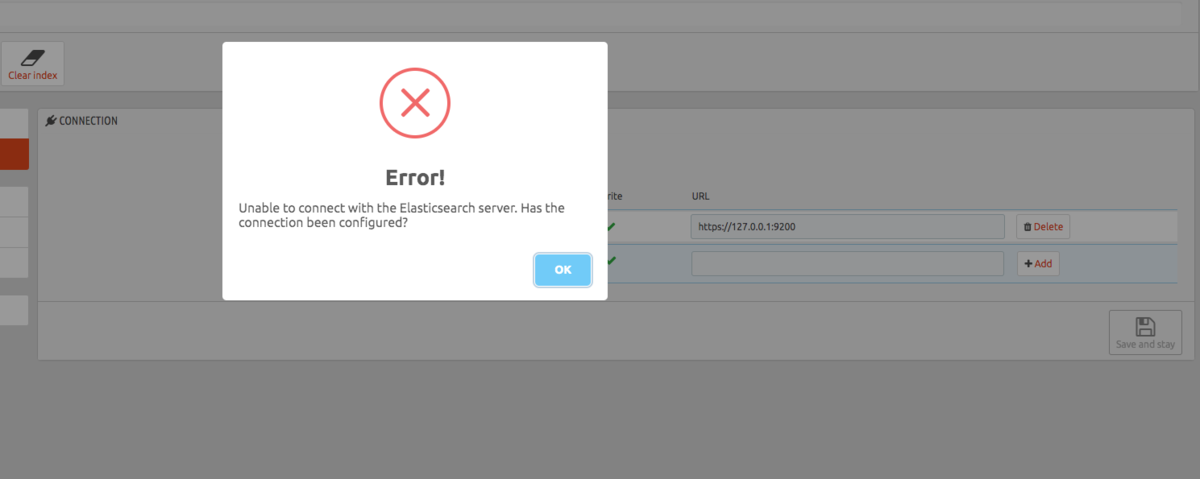
The CURL works in terminal - I get a confirmation that elasticsearch is running and ready to go. I finally got the module to give me an error after hours of trying stuff: Error! Unable to connect with the Elasticsearch server. Has the connection been configured? The weird part is, from the server side, everything appears to be fine! [root@odedi54851 ~]# sudo /etc/init.d/elasticsearch status ● elasticsearch.service - Elasticsearch Loaded: loaded (/usr/lib/systemd/system/elasticsearch.service; enabled; vendor preset: disabled) Active: active (running) since Sun 2019-06-09 16:37:50 EDT; 9h ago Docs: http://www.elastic.co Main PID: 735517 (java) CGroup: /system.slice/elasticsearch.service ├─735517 /bin/java -Xms1g -Xmx1g -XX:+UseConcMarkSweepGC -XX:CMSInitiatingOccupancyFraction=75 -XX:+UseCMSInitiatingOccupancyOnly -Des.networkaddress.cache.ttl=60 -Des.netw... └─735616 /usr/share/elasticsearch/modules/x-pack-ml/platform/linux-x86_64/bin/controller And the CURL command gets me this: Jun 09 16:37:50 odedi54851.mywhc.ca systemd[1]: Started Elasticsearch. [root@odedi54851 ~]# curl -XGET http://127.0.0.1:9200 { "name" : "2ZwYVKY", "cluster_name" : "elasticsearch", "cluster_uuid" : "OTZDSTDgQieIL1C7AL4rZw", "version" : { "number" : "6.8.0", "build_flavor" : "default", "build_type" : "rpm", "build_hash" : "65b6179", "build_date" : "2019-05-15T20:06:13.172855Z", "build_snapshot" : false, "lucene_version" : "7.7.0", "minimum_wire_compatibility_version" : "5.6.0", "minimum_index_compatibility_version" : "5.0.0" }, "tagline" : "You Know, for Search" So everything is running fine on the server!
-
I have reset the module. I have disabled all caches. I put the site in debug mode and get nothing. My feeling is that the connection is just not happening somehow.
-
I wish I was getting to 33%. 🙂 I have disabled all the caches, will try again.
-
The argument makes sense but the code at line 377 of my version does not seem to accommodate that. I did try, same results. This fix is from 2018. Perhaps more was added since?
-
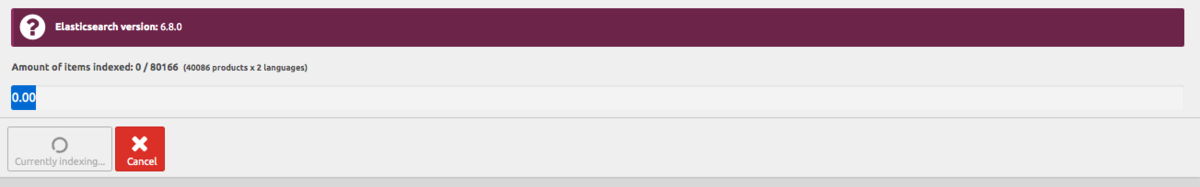
Read that, followed it to the letter, everything seems to work except the actual indexing... The frustrating part is that there is no error message, no way of knowing if anything is happening. It just spins and spins and spins. Nothing happens in the database. Yet, on the server side, everything appears to be working fine.
-
The logs only indicated the failures (until around 16:30 when I reinstalled 6): -- Logs begin at Fri 2019-06-07 17:40:08 EDT, end at Sun 2019-06-09 16:45:10 EDT. -- Jun 09 10:39:34 odedi54851.mywhc.ca systemd[1]: Started Elasticsearch. Jun 09 15:42:15 odedi54851.mywhc.ca systemd[1]: Stopping Elasticsearch... Jun 09 15:42:15 odedi54851.mywhc.ca systemd[1]: Stopped Elasticsearch. Jun 09 15:43:57 odedi54851.mywhc.ca systemd[1]: Starting Elasticsearch... Jun 09 15:43:57 odedi54851.mywhc.ca systemd[1]: Started Elasticsearch. Jun 09 15:44:01 odedi54851.mywhc.ca systemd[1]: elasticsearch.service: main process exited, code=exited, status=1/FAILURE Jun 09 15:44:01 odedi54851.mywhc.ca systemd[1]: Unit elasticsearch.service entered failed state. Jun 09 15:44:01 odedi54851.mywhc.ca systemd[1]: elasticsearch.service failed. Jun 09 16:37:50 odedi54851.mywhc.ca systemd[1]: Started Elasticsearch.
-
With version 6 I would get this with that command: [root@odedi54851 ~]# curl -X GET "localhost:9200/" { "name" : "2ZwYVKY", "cluster_name" : "elasticsearch", "cluster_uuid" : "OTZDSTDgQieIL1C7AL4rZw", "version" : { "number" : "6.8.0", "build_flavor" : "default", "build_type" : "rpm", "build_hash" : "65b6179", "build_date" : "2019-05-15T20:06:13.172855Z", "build_snapshot" : false, "lucene_version" : "7.7.0", "minimum_wire_compatibility_version" : "5.6.0", "minimum_index_compatibility_version" : "5.0.0" }, "tagline" : "You Know, for Search" } With version 5, I get a cannot connect. However, everything is fine in the firewall. I just reinstalled 6 to see if anything had changed, and lo and behold, it still works and I can connect.
-
I saw that. It is still failing.
-
I installed Elastic Search 5. I get a Failed connect to 127.0.0.1:9200; Connection refused, which was not a problem with version 6. I checked the firewall and the port is authorized both ways.
-
I will uninstall Elastic Search 6 and try installing 5.
-
Yes, I did tune MariaDB with mysqltuner/ Server is unmanaged, with some limited support. In cpanel, I have changed to MPM_Event.
-
How big is your tb_product_lang table? 58.3 MB Did you have a look at the Preferences->Search entry in your backoffice. Maybe you can set some weights to zero... Will have a look
-
There is an extensive blacklist there, wich I guess should not be indexed in the tb_search_index table.
-
OS: CentOS Ram: 30 GB Cpu: Intel(R) Xeon(R) CPU E3-1231 v3 @ 3.40GHz (8 processors) Cpanel PHP version: 7.1 MariaDB 10.3.15, InnoDB, all rows Compressed Thanks for the help!
-
I tried to change the server settings to 127.0.0.1:9200 as it does correspond to my localhost and it seemed to have worked for someone here in the forum. No dice.
-
curl is active on the server, and all the java dependencies, everything is up to the latest version.
-
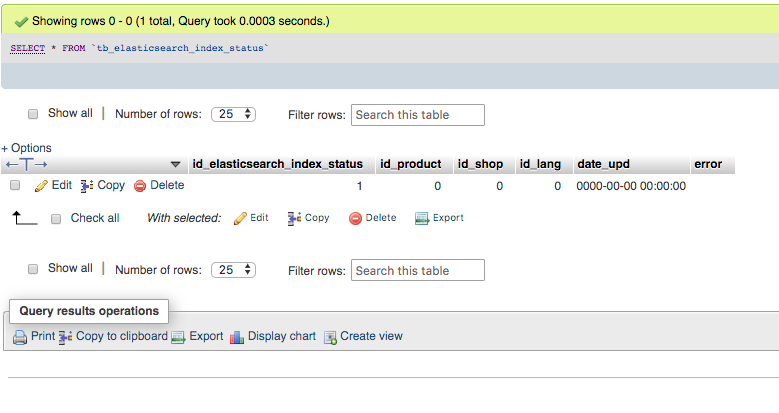
Here is the situation with the database, despite almost an hour of "indexing"...
-
OK. I installed Elastic Search 6.8.0 on my server. Everything seems to work normally, access via port 9200, which i enabled in the firewall. From the terminal, everything connects and Elastic Search is active and working. I now have installed the Elastic Search module for TB. It does see the version of Elastic Search. I have set the server to connect as follows:https://localhost:9200 I setup and followed all the other parameters in the instructions. Everything seems to work except two things: My theme requires search to be in the hook displaynav instead of displaytop - I was thinking of adding the following after the displayTop instructions: public function hookDisplayNav() { return $this->hookDisplayTop(); } Second thing, more worrisome, nothing seems to be indexing. It spins and spins and spins but nothing happens. Index in Database remains empty. See attachment.
-
Thanks for the references. I did try a rebuild and it got back to awful in a matter of days. Looking into the other possible solutions. I did try Elastic Search but that module does not seem to work properly.
-
Hello again, My search index table is getting massive. We have over 50,000 products. I ran a clean up program for the database and got the following warning: The table tb_search_index size is 116.72 Mb. Maybe you could clean unnecessary records from this table to reduce the size. This table alone is over a third of the database size. I have compressed it - and using InnoDB and Barracuda on MariaDB 10.3. Since it is the Search Index we are talking about, I am not sure we can get rid of anything without affecting the search itself. Any pointers?
-
Thank you all for the pointers! I finally got it working!
-
Yes, I have done that. My question is what do we put in auth? The password? If so, how safe is that? What is Database ID supposed to be for?
-
Hi everyone, Trying to setup Redis cache. I have a single server, so I keep it at the server IP address. The port seems OK too: 6379. But what I am not clear on is what to write in Auth and Database ID. Auth has nothing at all in it and Database ID is at 0. Clicking on testing server makes everything go red. I am not sure it activates at all. It causes 500 error on some pages.